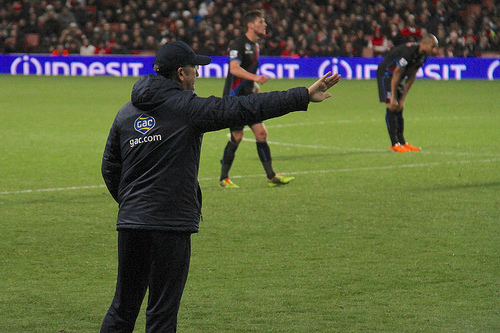
Trying to determine which Premier League managers are doing well and which are not is an on-going debate that has kept publicans in business for generations. I have always admired the unfashionable managers like Big Sam (of the baggy suits), Tony Pulis (of the club shop), and David Moyes (in his steely Everton incarnation), because they consistently seem to get disparate groups of players to punch above their collective weights. This opinion has seen me endlessly attacked and ridiculed, and so I am going to use this post to explain my rationale.
It is not a romantic view but it is a fact (as Rafa would say) that, in football, money doesn’t talk, it swears, and that that swearing manifests itself by means of the total wage bill. Clubs that pay more on wages should, all other things being equal, finish higher in the league than those that pay less. Of course, there are other factors that affect finishing positions, such as, supporters (Liverpool and Everton fans must be worth at least three or four points a season), injuries, whether your club is burdened by the tedious Europa league or a delusional Chairman, and so on.
Similarly, the conclusions suggested by this measure do not take account of style or entertainment provided, and I think that the Toon Army might quickly point out the different experience of watching Kevin Keegan’s Newcastle relative to Big Sam’s more pragmatic version. But, on the whole, the total annual wage bill is the least subjective yardstick available and so, I think, should set the par score by which managerial accomplishment is to be judged.
By this logic, Pellegrini should win the PL title this season and anything less than that would be an underachievement. Of course, that makes it difficult for him to impress, but there are less glamorous jobs available in the PL, should he prefer a different challenge. I think that the way in which Pellegrini, and his celebrated peers at the more fashionable clubs, can impress, is to win by playing attractive football (which City are) and/or to win a cup or two as well (which they haven’t).
I have put together the table below using the most recent data that I could find online; note that clubs will not report this season’s wage bill until after the season finishes, and so my figures are, by necessity, from last season. I couldn’t find anything authoritative for Crystal Palace, but if anyone can, or if anyone can provide a better source for my other figures then please let me know.
I do not intend this to be definitive or to suggest that it is 100% accurate (we have Deloitte for that), but it is my best effort. Note that it is impossible for City to top this particular table, because there is not enough scope for them to overachieve relative to their expected par finish, but the table does provide a rough view of how clubs are performing relative to their financial expenditure.
Tempting though it is to launch into a defence of my long-held positions regarding certain managers, I will just let the numbers speak for themselves. The one observation I will make is that Bill Kenwright does a pretty good job of recruiting managers. Perhaps Daniel Levy should ask him for some advice?
| Club | Wage Bill (m) | Date | Outperformance | Current League Position | Expected League Position | |
| Southampton | 47.1 | May-13 | 7 | 8 | 15 | |
| Crystal Palace | 12.5 (est.) | May-13 | 6 | 14 | 20 | |
| Liverpool | 132.2 | May-13 | 4 | 1 | 5 | |
| Everton | 63 | May-13 | 4 | 5 | 9 | |
| Hull | 36 | May-13 | 4 | 12 | 16 | |
| Stoke | 53 | May-12 | 3 | 10 | 13 | |
| Newcastle | 61.7 | May-13 | 2 | 9 | 11 | |
| Swansea | 35 | May-13 | 2 | 15 | 17 | |
| Chelsea | 176 | May-13 | 1 | 2 | 3 | |
| West Ham | 56.2 | May-13 | 1 | 11 | 12 | |
| Norwich | 34 | May-13 | 1 | 17 | 18 | |
| Arsenal | 154 | May-13 | 0 | 4 | 4 | |
| Tottenham | 90 | May-13 | 0 | 6 | 6 | |
| Cardiff | 30 | May-13 | 0 | 19 | 19 | |
| Man City | 233 | May-13 | -2 | 3 | 1 | |
| West Brom | 50 | May-13 | -2 | 16 | 14 | |
| Man Utd | 182 | May-13 | -5 | 7 | 2 | |
| Aston Villa | 70 | May-13 | -6 | 13 | 7 | |
| Fulham | 62 | May-13 | -8 | 18 | 10 | |
| Sunderland | 64 | May-13 | -12 | 20 | 8 |
Notes:
- Date
The date for which the most recent figures are available. This is the end of the 2012/2013 season for all clubs except Crystal Palace, for which it is the end of the 2011/2012 season. - Outperformance
The difference between expected position and current position. - Current League Position
As at Saturday morning, 12 April 2014. - Expected Position
Expected finishing position on the basis of total annual wage bill.
